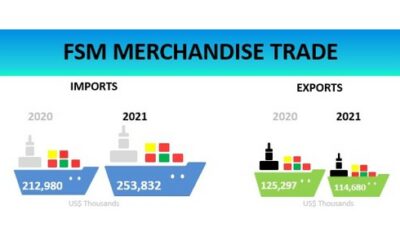
International Merchandise Trade

Classification: Harmonized Commodity Description and Coding System (HS) 2022
Valuation: Data are reported using thousands of US dollars. Exports are reported on a FOB (free on board) basis and imports are valued on a CIF (cost, insurance, and freight) basis.
Data Source: Quarantine Unit, Customs Unit, and enterprises

Trade Balance

 ($US Thousands) 2019 2020 2021 2022 2023
FSM -166,712 -87,924 -141,821 -121,726 -87,598
Chuuk -58,797 -57,238 -68,735 -65,557 -70,925
Kosrae -14,510 -14,819 -15,726 -20,762 -20,449
Pohnpei -91,560 -102,448 -133,962 -117,269 -122,857
Yap -26,427 -34,632 -31,953 -31,656 -34,460


 ($US Thousands) 2019 2020 2021 2022 2023
FSM 206,445 213,193 256,668 247,244 261,142
Chuuk 61,484 58,254 70,038 66,808 73,485
Kosrae 16,325 15,693 17,718 23,955 22,035
Pohnpei 99,513 104,016 136,550 121,545 128,653
Yap 29,123 35,231 32,362 34,935 36,969
($US Thousands) 2019 2020 2021 2022 2023
FSM 39,733 125,269 114,847 125,519 173,543
Chuuk 2,687 1,015 1,303 1,252 2,560
Kosrae 1,815 874 1,992 3,193 1,586
Pohnpei 7,954 1,568 2,588 4,276 5,796
Yap 2,695 599 409 3,279 2,510

Latest Releases

Documents