Consumer Price Index
The Consumer Price Index (CPI) is a measure which provides information on the cost of living for the FSM, including each of the four states which make up the FSM. It achieves this by producing an index, which indicates the cost of living at a particular time point, which in turn can be compared to other time points to determine if the cost of living is increasing or decreasing.
The index is produced by collecting prices for a “basket” of goods each quarter, which reflects the spending patterns of a typical household in FSM (nb: the “basket” changes slightly between the states, due to the different spending patterns of each of the four states). These prices are then monitored over time to determine if the cost for each item has increased or decreased.
Starting from 2019, the FSM Division of Statistics will switch to calculating and publishing its quarterly Consumer Price Index (CPI) series based on an updated set of weights and basket of representative goods and services. Concurrent with the update of weights, the classification used for publication will change to the COICOP classification to facilitate international comparisons of inflation in FSM to other countries in the world, and the Pacific in particular.
Click here for the FSM CPI rebase methodology

| Period | ALL GROUPS | Domestic items | Imported items |
| Q4-2018 | 2.47% | 2.97% | 2.23% |
| Q4-2019 | 1.33% | 4.66% | -0.30% |
| Q4-2020 | -0.30% | 1.38% | -1.17% |
| Q4-2021 | 5.39% | 6.14% | 5.00% |
| Q4-2022 | 6.53% | 6.75% | 6.41% |
| Q4-2023 | 4.75% | 4.41% | 4.93% |
| Source: FSM Statistics | |||
| Notes: 1. Base 2017 qtr 1 = 100 | |||
| 2. 2023 is still preliminary | |||
| Period | FSM-All groups | Kosrae-All groups | Pohnpei-All groups | Chuuk-All groups | Yap-All groups |
| Q4-2018 | 2.47% | 0.02% | 1.06% | 1.30% | 0.09% |
| Q4-2019 | 1.33% | 0.00% | 1.06% | 0.50% | -0.23% |
| Q4-2020 | -0.30% | 0.01% | -0.91% | 0.31% | 0.28% |
| Q4-2021 | 5.39% | 0.37% | 3.20% | 1.03% | 0.79% |
| Q4-2022 | 6.53% | 0.72% | 4.70% | 0.61% | 0.50% |
| Q4-2023 | 4.75% | 0.57% | 1.89% | 1.69% | 0.60% |
| Source: FSM Statistics | |||||
| Notes: | 1 Base 2017 qtr 1 = 100 | ||||
| 2. 2023 is Preliminary | |||||
| Period | FSM-All groups | Kosrae-All groups | Pohnpei-All groups | Chuuk-All groups | Yap-All groups |
| Weights | |||||
| 100% | 8.9% | 47.0% | 29.1% | 15.0% | |
| Annual | |||||
| 2020 | 104.9 | 99.8 | 104.8 | 107.6 | 103.3 |
| 2021 | 108.3 | 101.8 | 110.1 | 107.7 | 107.4 |
| 2022 | 114.0 | 107.8 | 117.3 | 112.1 | 111.2 |
| 2023 | 120.6 | 119.8 | 122.6 | 119.6 | 116.6 |
| Quarter | |||||
| Q4-2020 | 104.4 | 99.8 | 103.9 | 107.1 | 103.5 |
| Q4-2021 | 110.1 | 104.2 | 111.1 | 110.8 | 108.9 |
| Q4-2022 | 117.2 | 113.0 | 122.1 | 113.1 | 112.6 |
| Q4-2023 | 122.8 | 120.5 | 126.8 | 119.9 | 117.3 |
| Source: FSM Statistics | |||||
| Notes: 1. Base 2017 qtr 1 = 100 | |||||
| 2. 2023 is Preliminary | |||||
Latest Releases
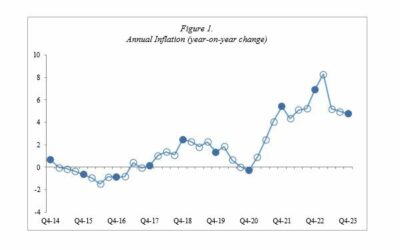
Consumer Price Index 2023
The annual inflation in the 4th quarter of 2023 was 4.7% for All Groups…
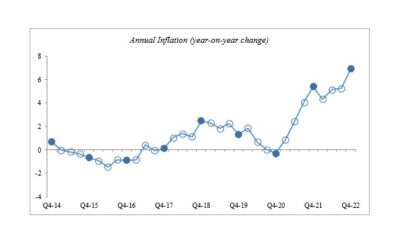
Consumer Price Index 2022
This release gives information on changes in the Consumer Price Index (CPI) for the Federated Statesof Micronesia (FSM) and the four states - Chuuk, Kosrae, Pohnpei and Yap. Appendix 1 contains thedetailed tables for FSM and the four states. Annual Inflation In this...
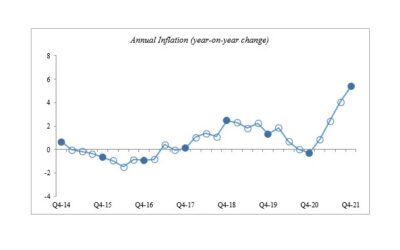
Consumer Price Index 2021
This release gives information on changes in the Consumer Price Index (CPI) for the Federated Statesof Micronesia (FSM) and the four states - Chuuk, Kosrae, Pohnpei and Yap. Appendix 1 containstables with detailed data for FSM and the four states. Annual Inflation The...